
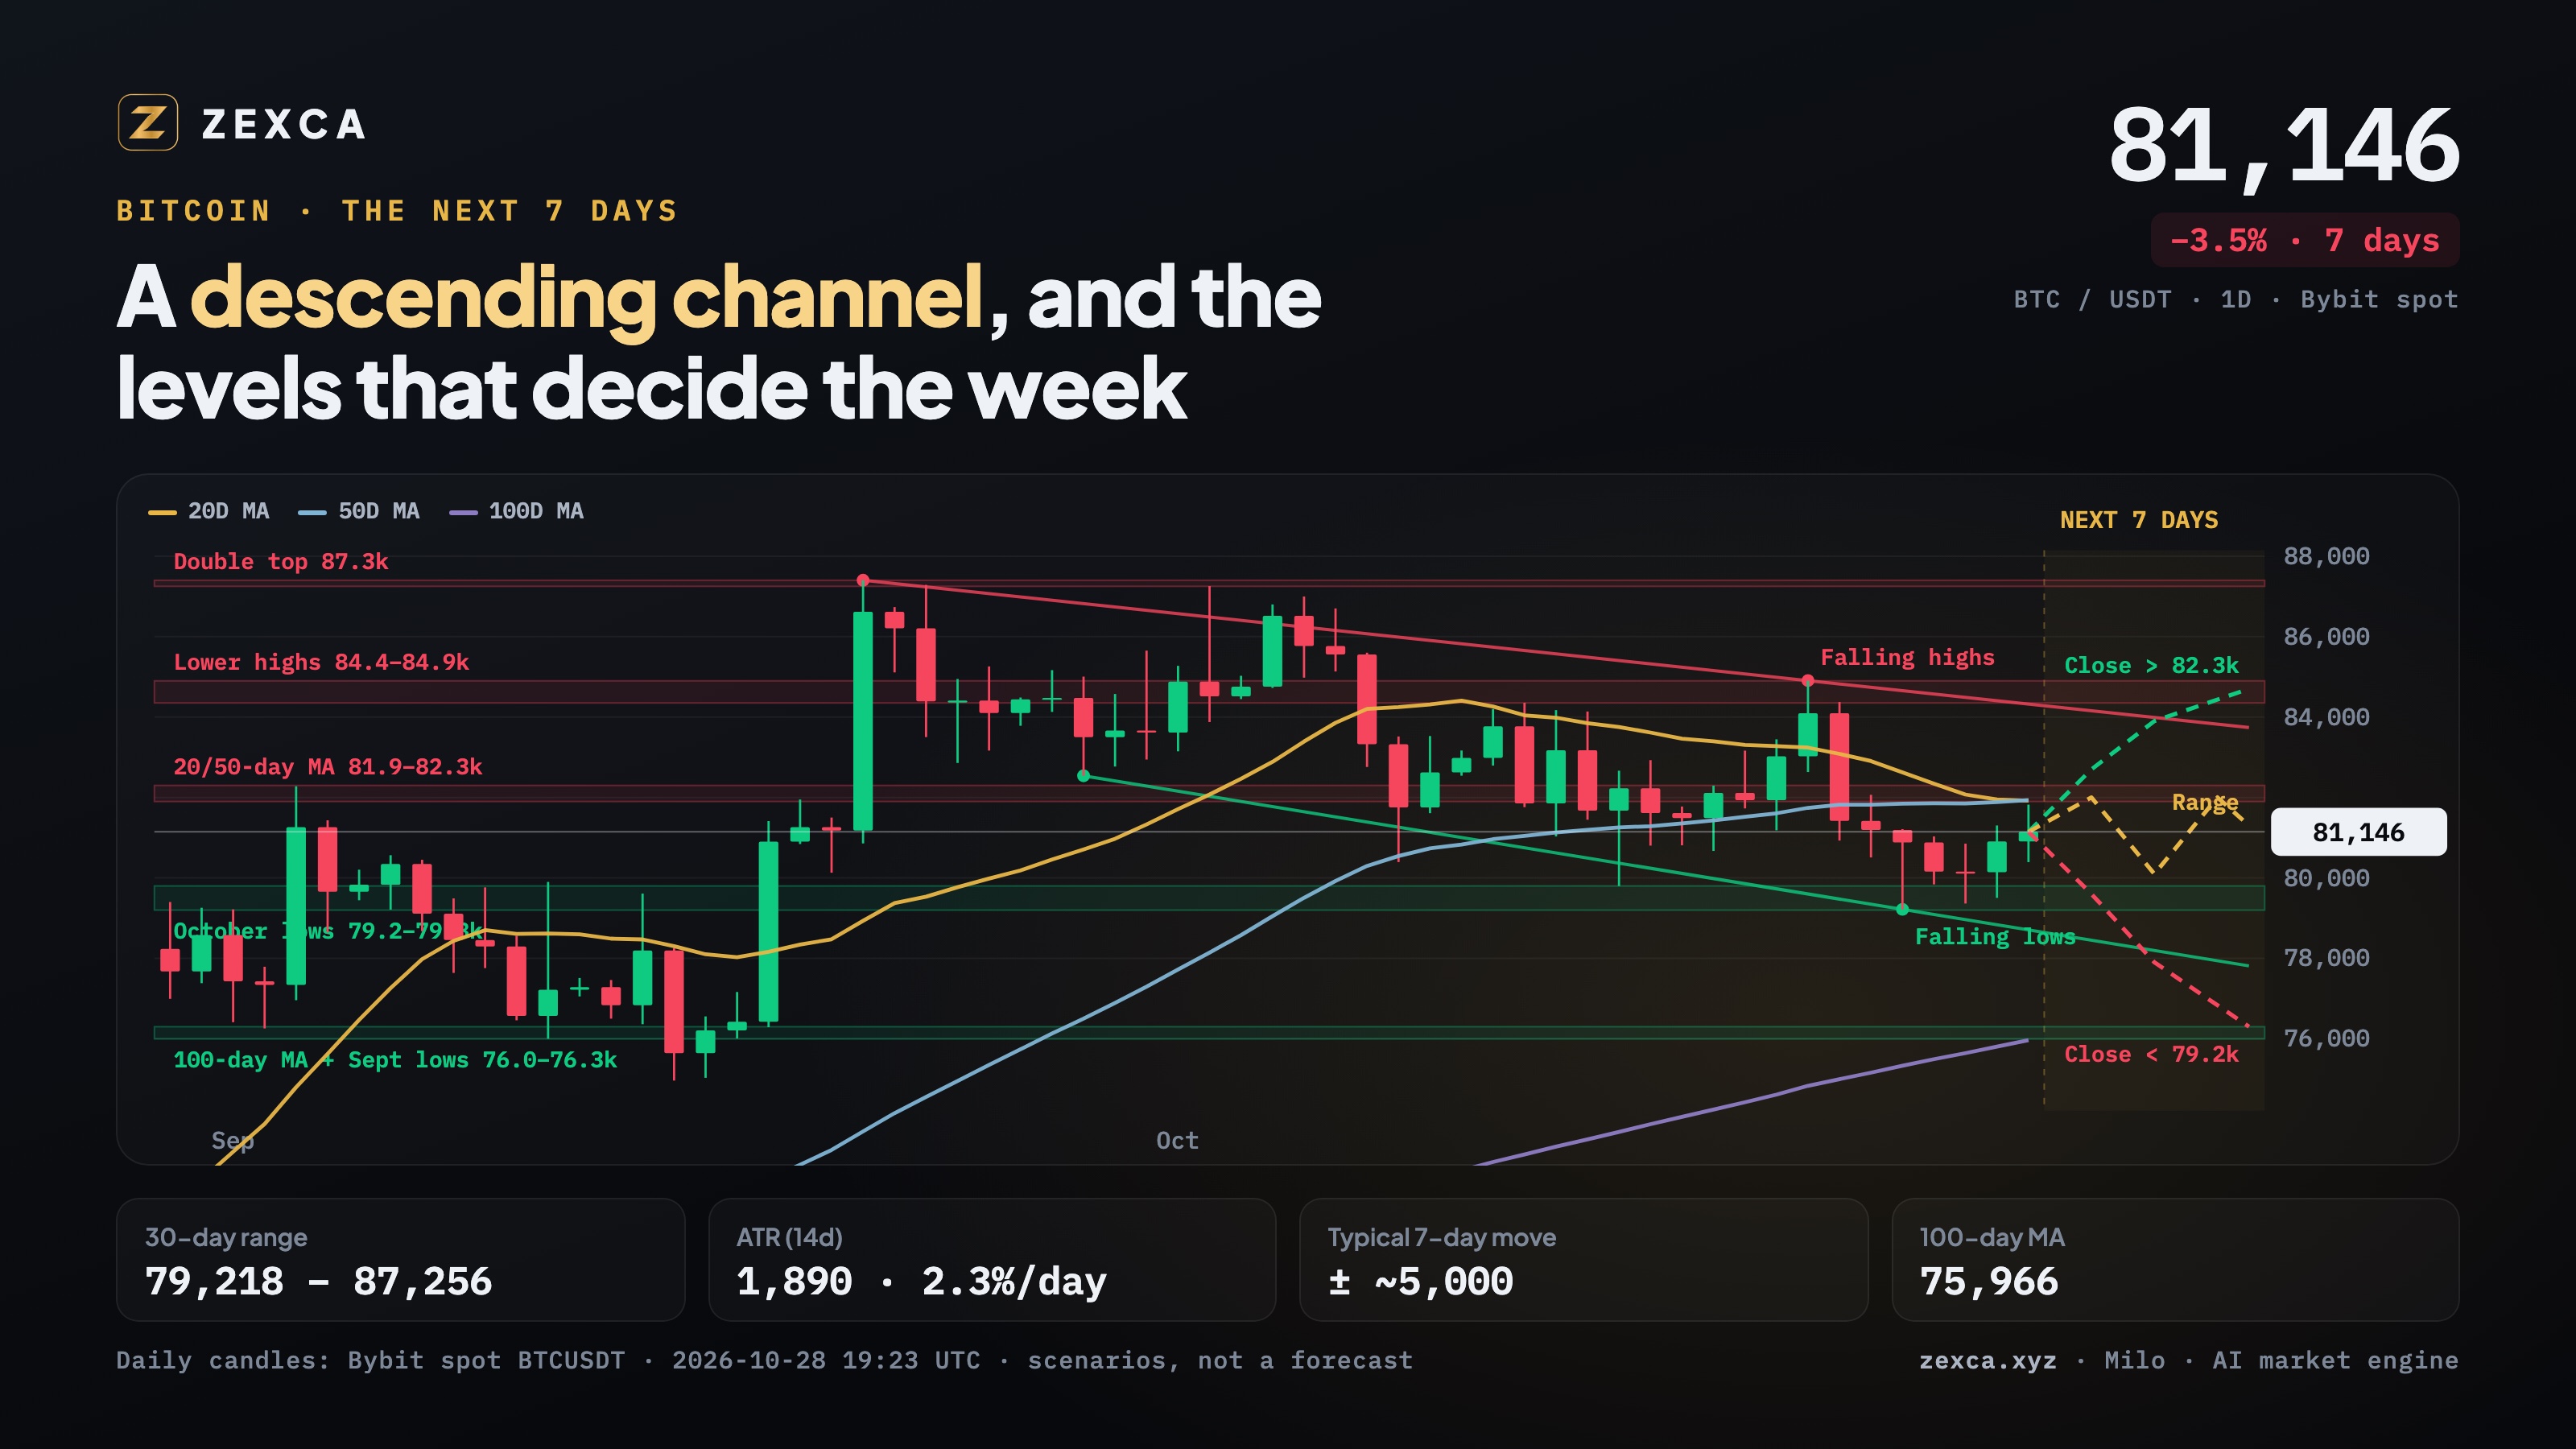
Data: daily BTCUSDT candles from Bybit spot, 28 October 2026, 19:23 UTC. This is analysis, not advice. Scenarios describe what the chart would imply if a level breaks; they are not a forecast.
Where Bitcoin stands
Bitcoin is trading around 81,146, down 3.5% over 7 days and about 2.8% over 30 days. Over the last month it has moved between 79,218 and 87,256.
The more important point is the shape of that month:
- Lower highs. The two tops at 87.4k (21 Sep) and 87.3k (2 Oct) were followed by weaker highs at 84.4k (12 Oct) and 84.9k (21 Oct).
- Lower lows. The dips have also stepped down: 82.5k (28 Sep), 80.4k (8 Oct), 79.8k (15 Oct) and 79.2k (24 Oct).
Joining those highs and those lows gives a descending channel. Until price closes outside it, the short-term structure is down.
The moving averages
- The 20-day and 50-day averages sit together at about 81.9k, just above the price. Price is below both.
- The 100-day average is much lower, at 75,966, and still rising. The medium-term trend has not turned down.
So the picture is a short-term pullback inside a longer uptrend that is still intact.
The levels that matter this week
| Level | Zone | Why it matters |
|---|---|---|
| Resistance 3 | 87,250 – 87,400 | The double top of September and October |
| Resistance 2 | 84,350 – 84,900 | The two most recent lower highs |
| Resistance 1 | 81,900 – 82,300 | 20- and 50-day averages, plus the 3 Sep swing high |
| Support 1 | 79,200 – 79,800 | The October lows |
| Support 2 | 76,000 – 76,300 | The 100-day average and the September lows |
How far Bitcoin usually moves in a week
The average daily range over the last 14 days (ATR) is about 1,890, or 2.3% a day. Scaled to a week, a typical move is roughly ±5,000 either way. That is a useful guide for where stops should sit, and a reminder that a few thousand dollars of movement is normal, not a signal on its own.
Three scenarios for the next 7 days
1. Range (the base case while nothing breaks)
Price keeps trading between 79.2k and 82.3k, testing the averages from below. Inside a range, the edges are where trades are planned; the middle is where they are usually avoided.
2. Upside: a daily close above 82.3k
A close above the averages would be the first sign that the pullback is ending. The next area to watch is 84.4k–84.9k, where the falling channel's upper line also passes this week. Only a close above that would challenge the channel itself.
3. Downside: a daily close below 79.2k
Losing the October lows would extend the pattern of lower lows. The next support is 76.0k–76.3k, where the 100-day average and the September lows meet. That zone is where the longer uptrend would be tested.
How to use this analysis
- Wait for closes, not touches. Wicks through a level are common; a daily close beyond it carries more weight.
- Put stops beyond zones, not inside them. With a typical daily range of about 1,900, a stop a few hundred dollars from entry is likely to be hit by noise. See where to put a stop-loss.
- Size the position from the stop. Decide what one loss may cost first. See position sizing.
- Read the chart yourself. The zones are drawn in the image so you can check them against your own chart and add your own analysis.
Live signals with an entry zone, a stop and three targets are free on every Zexca account.
Educational content, not investment advice. Trading carries risk, including the loss of capital.