The Onchain Leaderboard is a ranked list of public wallet addresses on Hyperliquid, ordered by the profit they realised over a chosen period. Every figure on it is arithmetic over data the venue publishes about accounts anyone can look up.
It is worth saying plainly what that means. It is raw public data, not a selection or a recommendation. We did not choose these addresses and we do not know who they belong to. An address near the top made money over the period shown, and that is the whole of what the table says. No model is involved at any point: the ranking is a subtraction of two numbers and a sort.
Where the data comes from
The venue's own public information endpoint, read once every 24 hours by a scheduled job. Opening the page sends no request to the venue; you are reading a file written overnight. If that file is more than 36 hours old, the page says so rather than presenting stale figures as current.
Rankings are recomputed from scratch every night. Addresses enter, drop out and change position daily, and nothing is smoothed to keep the list steady. An address leaving is as informative as one arriving.
Deposits are not profit
This is the most important rule on the page, and the most common way a list like this is wrong elsewhere. An address that deposits $50,000 has not made $50,000.
Profit is taken from the venue's own profit-and-loss series, which excludes money moving in and out. That reading is then checked a second way:
- account value at the end of the period should equal
- account value at the start, plus profit, plus everything transferred in or out in between: deposits, withdrawals, transfers between addresses, and spot-token transfers at the dollar value the venue states.
If the two disagree by more than 2% of the account, the address is not published for that period at all. A missing row is better than a number nobody can explain. Money moved into a vault or a staking product counts as money moved, not as a trading result.
What each column means
| Column | What it measures |
|---|---|
| Profit | Change in realised and unrealised profit over the period, in US dollars, with deposits and withdrawals removed |
| Profit % | Profit divided by the average account value over the period, not the opening balance |
| Max drawdown | The largest peak-to-trough fall in the period, as a share of the account at that peak |
| Assets | How many distinct instruments were traded |
| Trades | How many fills |
Profit % uses the average account value for a reason. An account that started a period near zero would otherwise show a return in the thousands of percent: arithmetically true, and useless for comparison.
Max drawdown sits in the same row as profit, at the same weight. A profit figure without it describes only half of what happened.
Who is left out
- Vaults, sub-accounts and agent wallets, identified by the venue's own account role.
- Accounts below a minimum size, whose percentages cannot be compared with anything.
- Accounts with very few trades in the period. Over 30 days or longer: fewer than 10 trades, or a single instrument. Over 7 days: fewer than 5 trades. Over 24 hours: fewer than 3.
- A short list of protocol and market-maker addresses that are technically user accounts but are not anyone's personal trading.
- Any address whose figures do not reconcile.
What the figures cannot tell you
Trade history is limited. The venue keeps only the most recent 10,000 fills per address, which for a very active account can be a few days. Where the fill history does not cover the whole period, the row is marked thin history and no win rate is shown.
Long periods have approximate starting points. The venue samples long histories every 7 to 14 days, so a 365-day figure is measured from the last sample at or before that point. The exact start used is published with each row.
Past results say nothing certain about the future. A ranking describes what happened. It is not a forecast, and it is not a reason to copy anyone's positions.
The badges
Badges describe something in the data. They never change the order, which is by profit alone.
- single trade dependent: over half the gross profit came from one trade
- high leverage: open positions worth more than 10× the account
- low diversity: fewer than three instruments traded
- deep drawdown: fell more than 40% from a peak during the period
- new account: less than 30 days of history
- thin history: the trade record does not cover the whole period
The live layer
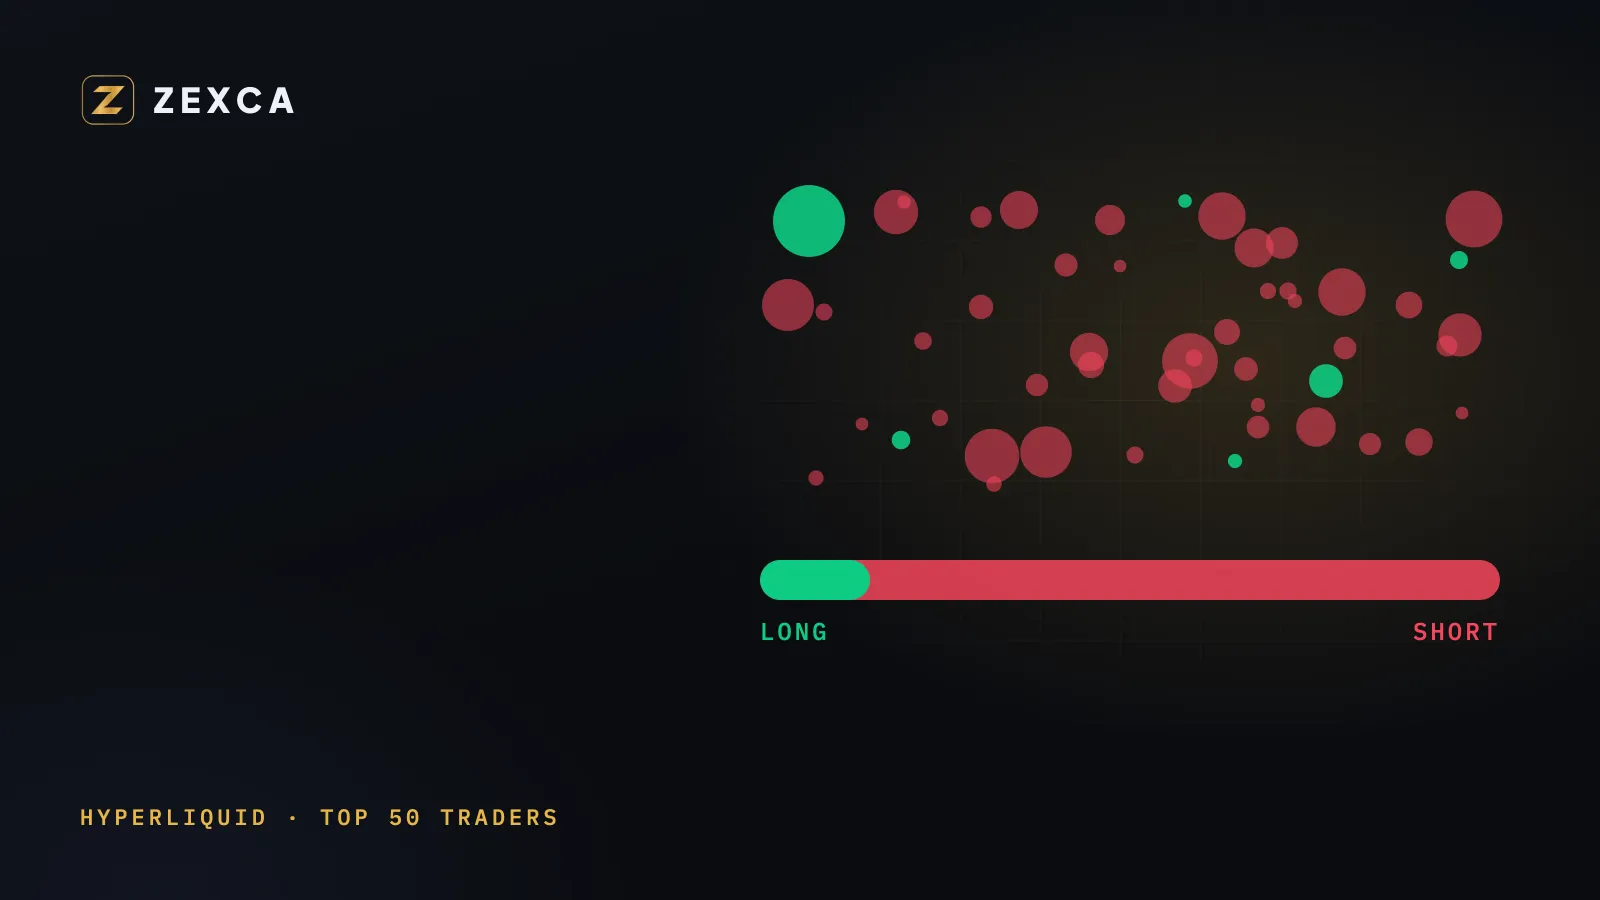
Alongside the nightly ranking, the platform follows the current positions of the top 50 addresses through the day: which side each is on, the size, the entry and the liquidation price. That is what the long/short split on the leaderboard page shows. It is the same public data, read more often.
Educational content, not investment advice. Trading carries risk, including the loss of capital.