
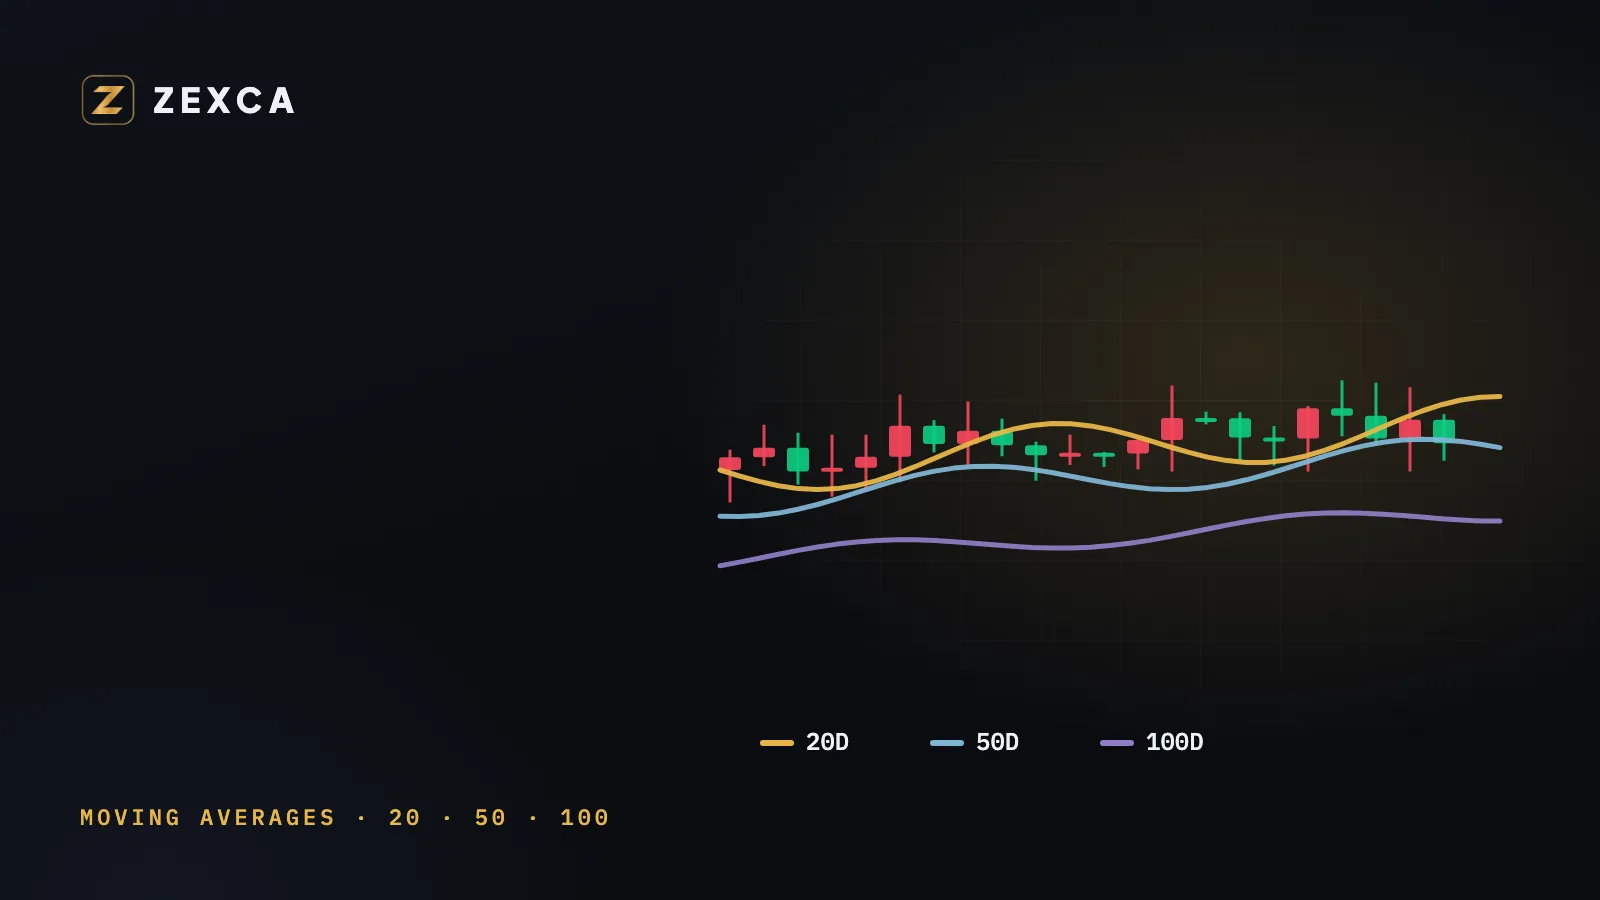
A moving average is the average closing price over the last N days, recalculated every day. Plot it under the candles and you get a smooth line that shows the direction of the market without the noise of each day. It is one of the oldest tools in technical analysis, and still one of the most watched.
How it is calculated
The 20-day simple moving average (SMA) is the sum of the last 20 daily closes divided by 20. Tomorrow, the oldest close drops out and the newest one comes in, so the line moves.
- The 20-day line follows the price closely. It shows the short-term trend.
- The 50-day line is slower. It shows the medium-term trend.
- The 100-day line is slower still, and is often read as the line between a healthy and a damaged trend.
How traders read them
Price above the line, line rising: the trend on that timeframe is up. Price below, line falling: it is down.
The lines as levels. In a trend, the price often pulls back to one of these lines and reacts there, so they act as moving support or resistance.
The order of the lines. When the 20-day is above the 50-day, which is above the 100-day, every timeframe agrees on an uptrend. When they are stacked the other way, they agree on a downtrend. When they are tangled, the market is undecided.
Crossovers. The 20-day crossing the 50-day is a common early sign that momentum has turned. Crossovers lag, because averages are made of past prices, so they confirm a move more than they predict one.
A real example: Bitcoin and Ethereum, 25 October 2026
These are the daily figures from Hyperliquid at 12:20 UTC, the same ones behind Zexca's market analysis posted that day:
| Price | 20-day | 50-day | 100-day | |
|---|---|---|---|---|
| Bitcoin | 80,404 | 82,327 | 81,834 | 75,474 |
| Ethereum | 2,332.5 | 2,455 | 2,544 | 2,317.5 |
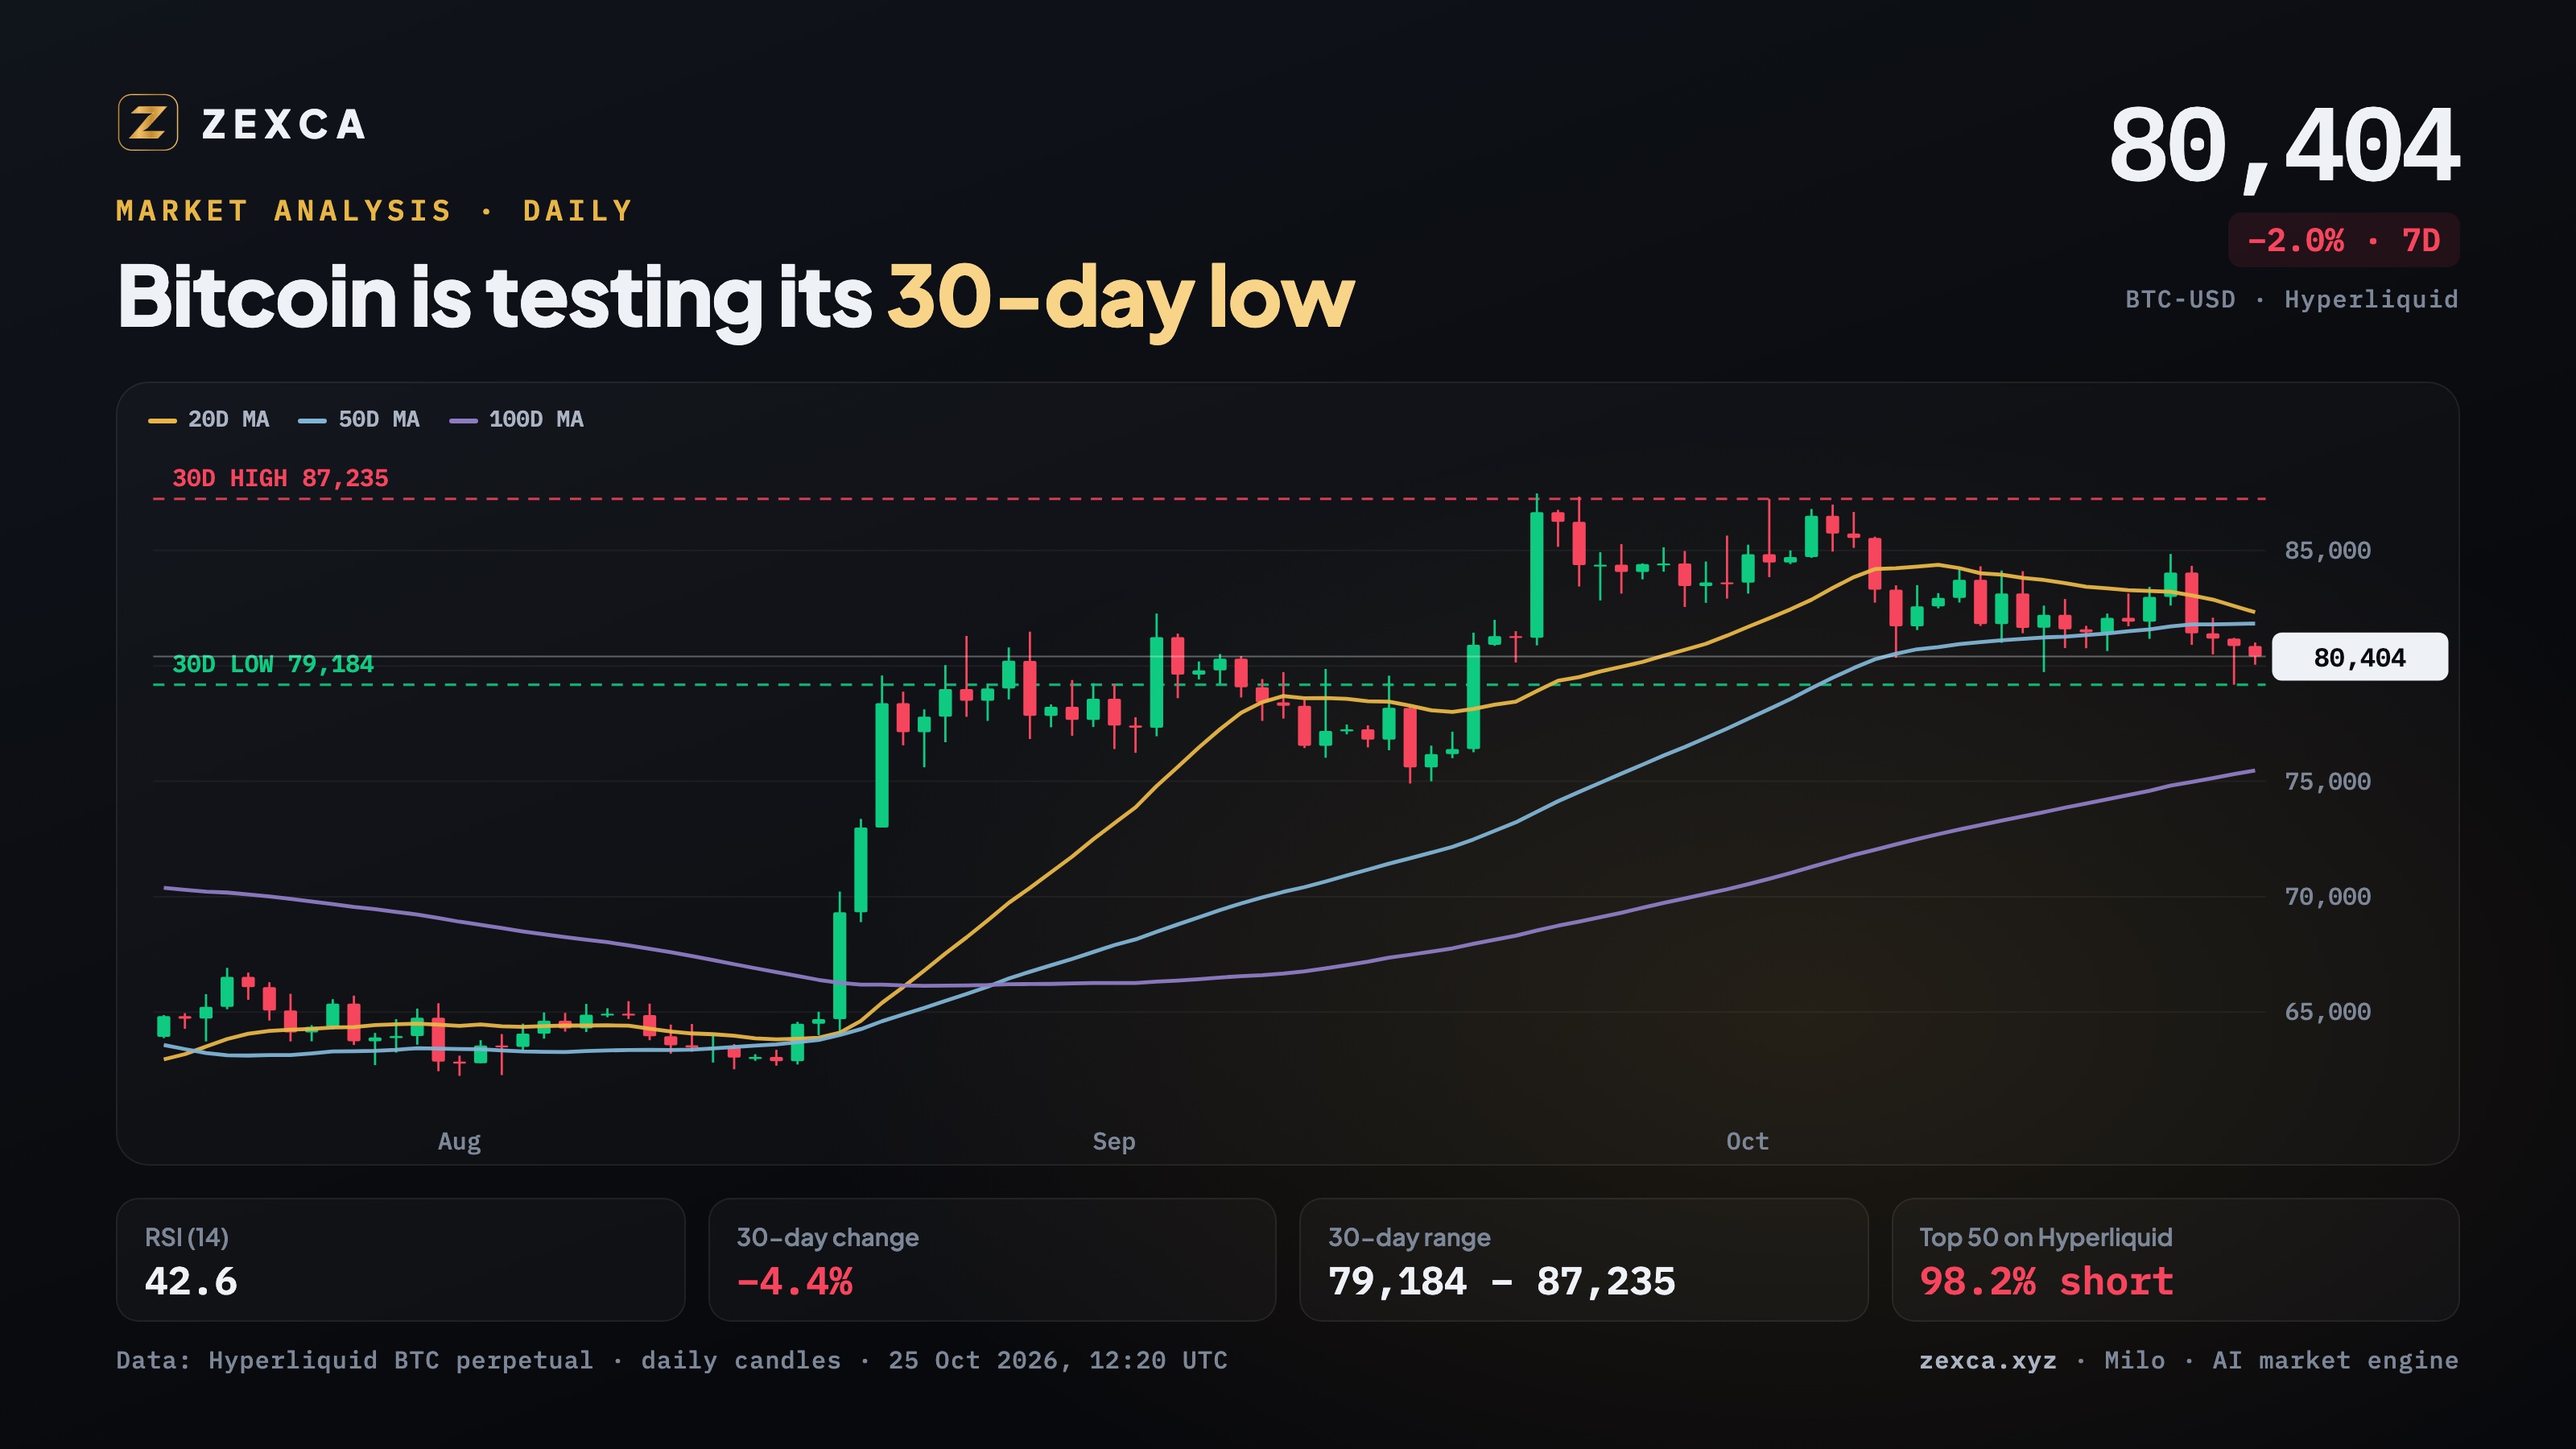
Bitcoin was below its 20-day and 50-day lines, which had turned into resistance overhead, but still well above the 100-day. The short-term trend had weakened; the longer one had not broken.
Ethereum was below both its 20-day and 50-day lines and sitting almost exactly on its 100-day average, after a 13.3% fall in 30 days. That is the kind of moment the 100-day line is watched for: holding it keeps the longer trend intact, losing it is a sign the damage is spreading.
Neither reading is a forecast. They describe where the price stands against its own recent history, which is exactly what a moving average is for.
Common mistakes
- Treating a line as a wall. Prices cross moving averages all the time. A level is an area, not an exact price.
- Using too many lines. Three is plenty. Ten lines will always contain one that "worked".
- Trading every crossover. In a sideways market, lines cross back and forth and every signal is a false one.
- Forgetting the timeframe. A 20-day line on a daily chart and a 20-period line on an hourly chart answer different questions.
Where you see this on Zexca
Milo, the AI behind Zexca's market analysis, reads trend, momentum and order flow across forex, gold, crypto and stocks every second. The moving averages are one input among many, and the Zexca signals and analysis posts name the levels they come from. If you want to go further, the Zexca Academy covers trend reading chapter by chapter.
This article is education, not financial advice.
Educational content, not investment advice. Trading carries risk, including the loss of capital.