A price chart tells you where the market went. It doesn't tell you who took it there, or whether they're still pushing. That's what order flow is about.
It sounds technical, but the idea is simple. And on Zexca, Milo shows it to you live.
The two sides of every price
Every trade has a buyer and a seller. But they don't arrive in the same way:
- Some traders wait. They leave orders sitting in the market: "I'll buy at this price", "I'll sell at that price". These waiting orders make up the order book.
- Other traders don't wait. They hit the market right now, at whatever price is available. These are the trades that actually move the price, and the list of them is called the tape.
Order flow is about watching both: who's waiting, and who's acting.
The order book: who's waiting
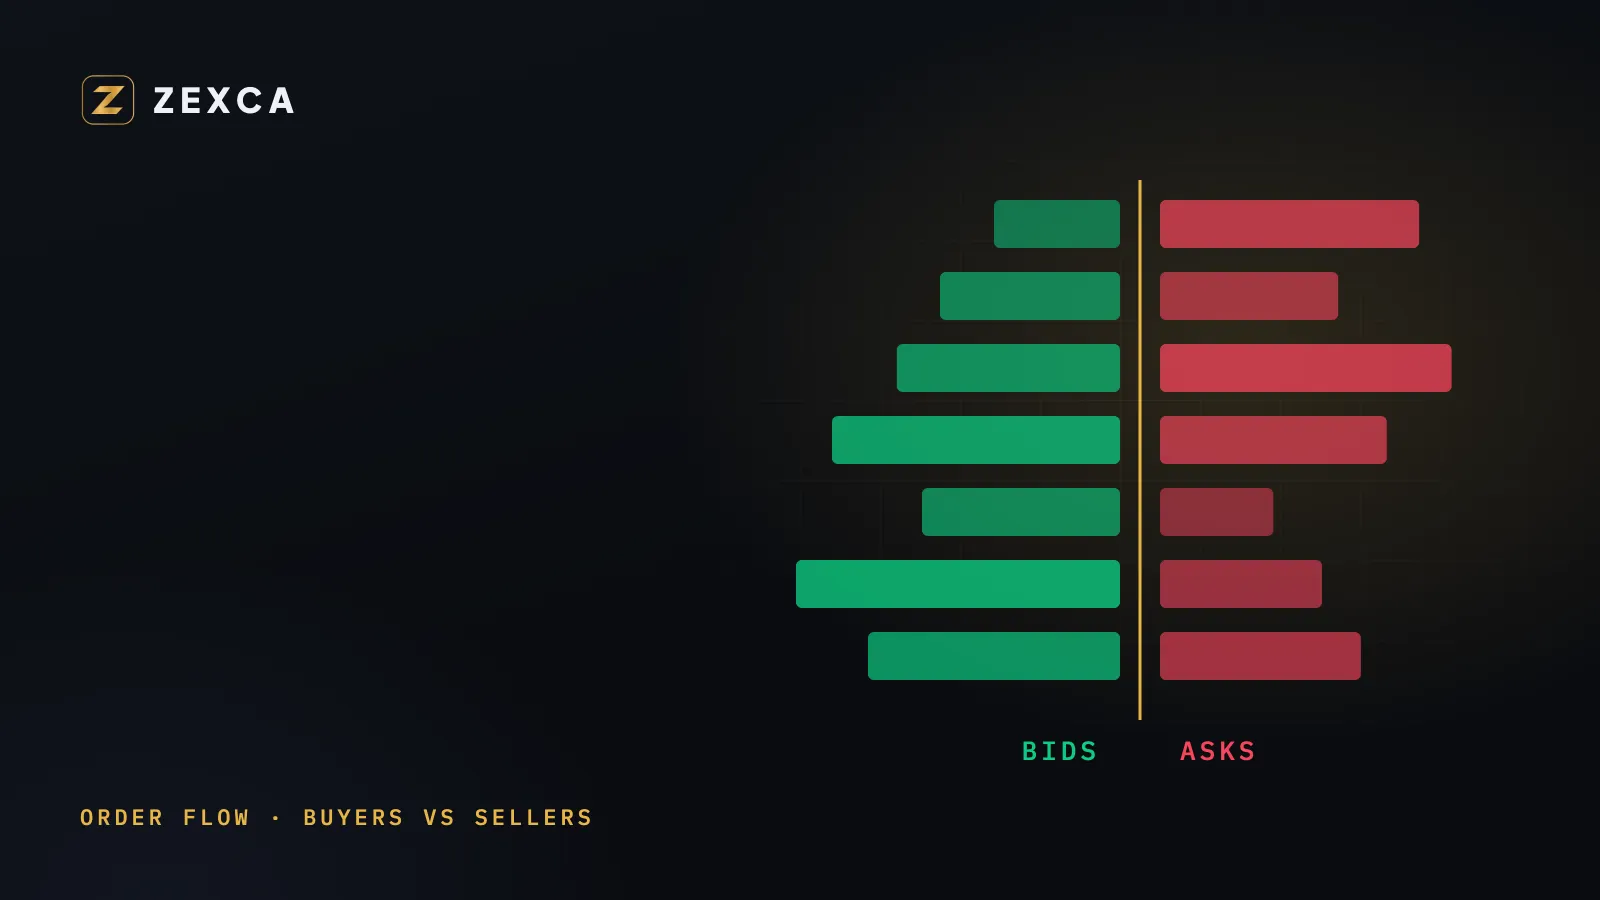
Picture a ladder. On one side are the waiting buy orders (called bids), on the other the waiting sell orders (called asks). If there are far more bids than asks near the price, it looks like buyers are ready to support it.
But here's the catch: waiting orders can be pulled at any moment. A big wall of bids can disappear the second the price comes near it. So the book shows intention, not commitment.
The tape: who's acting
The tape is the record of trades that actually happened. If most of the trades in the last few minutes were buyers hitting the market, buying pressure is real, because someone actually paid. That's why many traders trust the tape more than the book.
Volume delta is a simple way to sum it up: the difference between buying and selling volume over a period. Positive means buyers did more of the pushing. Negative means sellers did.
When the two disagree
The most interesting moments are when the book and the tape tell different stories. For example:
Lots of bids are resting under the price, but the trades going through are mostly sellers.
That usually means buyers are showing size but not taking it, while sellers are actually pressing. Milo puts this into one plain sentence, so you don't have to work it out from the numbers.
How Milo shows order flow
In the Zexca AI terminal, the Order Flow Intelligence panel shows, for the market you're watching:
| Reading | What it means |
|---|---|
| Buy pressure | How strong buying is right now |
| Order flow | Overall lean: bullish or bearish |
| Volume delta | Buying volume minus selling volume |
| Book imbalance | Whether waiting orders lean to bids or asks |
| Tape imbalance | Whether actual trades lean to buyers or sellers |
| Spread | The gap between the best bid and the best ask |
Order flow is also one of the gates in Milo's Opportunity Funnel: a move only counts as a real opportunity if the order flow leans the same way as the move. A rally that buyers aren't actually paying for doesn't make the cut.
Using order flow without overthinking it
- Use it to confirm, not to predict. Order flow is a great second opinion on a setup you already like.
- Trust actions over intentions. What traders did (the tape) usually matters more than what they say they'll do (the book).
- Watch for disagreement. When price rises but the flow turns to selling, be careful.
- Keep your stop. Order flow can change in seconds. Your stop loss is still your safety net.
See it live
Open a free Zexca account, head to the AI terminal and watch the order flow panel for ten minutes on a market you know. Then look at a free signal and check whether the flow agrees with it. It's one of the quickest ways to see the market the way Milo does.
Educational content, not investment advice. Trading carries risk, including the loss of capital.