
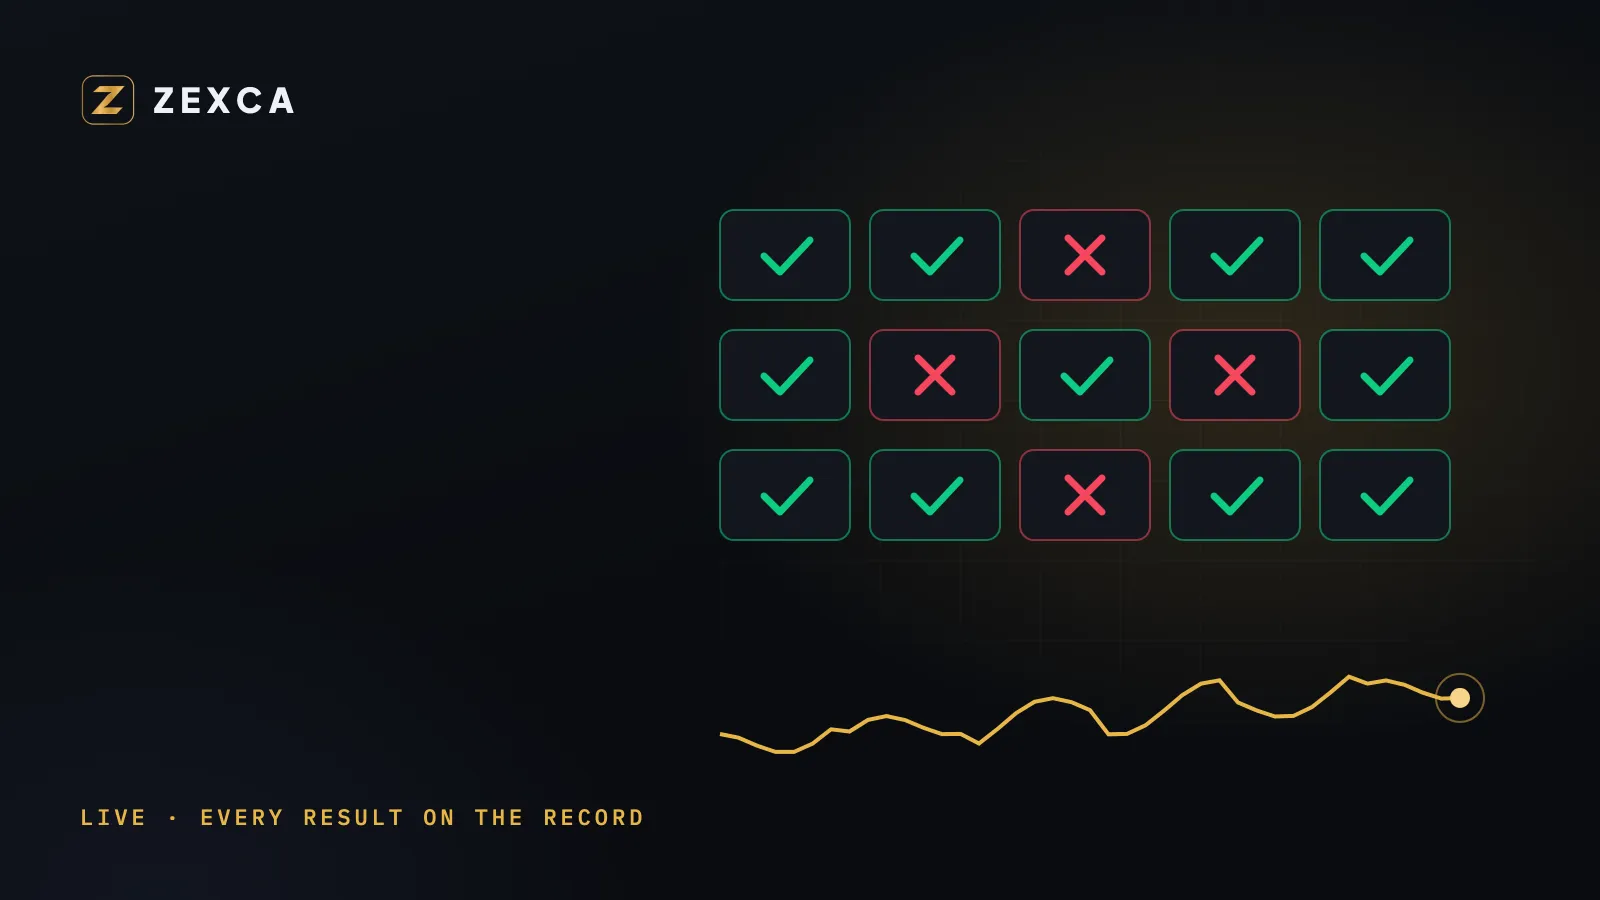
Trust in trading is simple to describe and hard to earn: show people what's really happening, including the bits that don't look great.
That idea runs through everything on Zexca. Here's what "live" and "real" look like on the platform, and how to make the most of it.
Live markets, every second
The Zexca AI terminal updates every second. Prices, the market radar, order flow, volatility and the opportunity funnel all move as the markets move. When something unusual happens — a sudden spike, a market breaking away from the pack — Milo flags it as it happens, not in tomorrow's summary.
The same goes for your signals. Every open signal shows a live price and a live result, so you always know where a trade stands.
Ups and downs, both shown
Markets go up and down. A platform that only shows the ups isn't showing you the market.
On Zexca, a signal that hits its stop is recorded as a loss, plainly, right next to the wins. And when a single candle touches both a target and the stop, Zexca records it as a stop. It's the cautious reading, so the record never looks better than reality.
Nobody closes signals by hand to tidy the numbers. The platform reads real price bars every minute and closes each signal the moment the market reaches its target or its stop.
The record you can actually check
Open the Signals dashboard and the whole history is there:
- Win rate — how many signals reached a target.
- Profit factor — total gains against total losses.
- Max drawdown — the deepest dip from a high point.
- Streaks — the longest run of wins, and of losses.
- Month by month — so you can see good months and tough ones.
You can also go through the History tab signal by signal, filter by market, and open any chart on TradingView to check the candles yourself.
Real data from the biggest traders
The Onchain Leaderboard takes "real" one step further. It ranks traders on Hyperliquid using public, onchain data, removes deposits so they can't be counted as profit, and leaves out any account whose numbers don't add up. Milo then follows what the top 50 hold through the day: long or short, how big, and where their liquidation levels sit. Here's the full method.
Your own progress, too
"Real" also means your own progress. In the Zexca Academy, every chapter you finish earns points, and your rank grows from Bronze to Diamond as you learn. It's your record, built by you.
How to read a live record wisely
- Look at months, not days. One great day or one bad day says very little.
- Check the drawdown. A good record shows how deep the dips went, not just how high the peaks were.
- Mind the sample size. Ten signals tell you less than a hundred.
- Remember the past isn't a promise. A record shows what happened. It helps you judge, but it can't tell you what tomorrow brings.
See it for yourself
The best way to trust a record is to watch it being written. Open a free Zexca account, follow a few free signals from open to close, and keep an eye on Milo in the AI terminal. Everything you see is live, and everything stays on the record.
Educational content, not investment advice. Trading carries risk, including the loss of capital.