
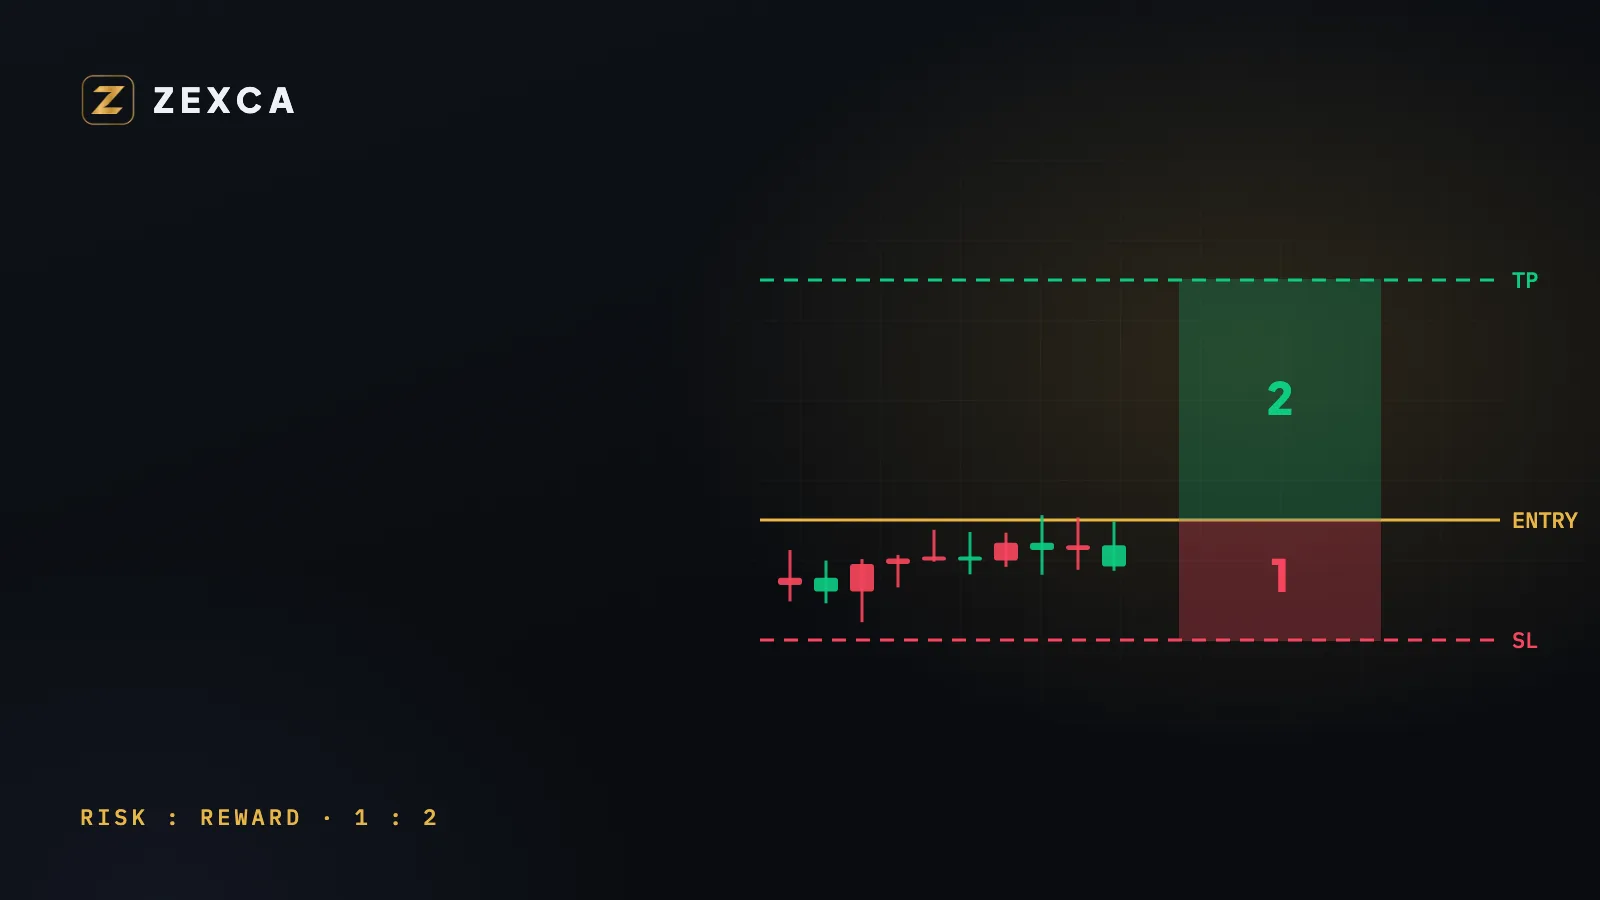
Every trading signal makes two promises at once: how far the price might go for you, and how far you will let it go against you before you are out. The risk-to-reward ratio (R:R) puts those two distances side by side, and it is the quickest way to judge whether a trade is worth taking.
How it is calculated
Measure two distances from the entry:
- Risk: entry to stop-loss.
- Reward: entry to the target.
Then divide the reward by the risk. If the stop is 2% away and the target 4% away, the ratio is 4 ÷ 2 = 2, written 1:2: you risk one part to make two.
It does not matter whether you measure in price, in percent or in points, as long as both distances use the same unit.
A real example from the Zexca record
Signal SG-89025 is a short on Bitcoin with an entry at 80,589.5:
| Level | Price | Distance from entry | Ratio |
|---|---|---|---|
| Stop-loss | 84,337.36 | 4.65% | — |
| Target 1 | 77,882.71 | 3.36% | 1:0.72 |
| Target 2 | 75,175.93 | 6.72% | 1:1.44 |
| Target 3 | 72,260.93 | 10.33% | 1:2.22 |
Three targets means three ratios. The first target is closer than the stop, the third is more than twice as far. Many traders take part of the position off at each target, so the trade's real ratio is a blend of the three.
The win rate each ratio needs
The ratio only means something next to the win rate. To break even over many trades, you need to win at least:
1 ÷ (1 + R) of the time, where R is the reward divided by the risk.
| Ratio | Break-even win rate |
|---|---|
| 1:0.72 | 58% |
| 1:1 | 50% |
| 1:1.44 | 41% |
| 1:2 | 33% |
| 1:2.22 | 31% |
| 1:3 | 25% |
So a high ratio can be profitable with a modest win rate, and a low ratio needs a high one. Neither is good or bad on its own; what matters is the pair. This is why Zexca publishes both: every signal's R:R is shown in its details and in the History tab, and the live win rate sits on the Signals dashboard, with every win and every loss kept on the record.
Mistakes that break the ratio
- Moving the stop further away. The ratio you calculated at entry no longer exists.
- Closing winners early by habit. A 1:2 plan that is always closed at 1:0.5 is a different strategy, usually a losing one.
- Placing targets to make the ratio look good. A target the price has no reason to reach is decoration. Targets belong at levels the chart actually offers.
- Ignoring leverage. Leverage multiplies both sides equally, so it never improves the ratio. It only changes the size of each side on your margin; see leverage explained.
How to use it with Zexca signals
- Open Signals in the Zexca dashboard and read the entry zone, the stop and the three targets.
- Check its R:R in the signal's details or in History, then the win rate on the dashboard.
- Decide how much of your account one trade may lose, and size the position so that the distance to the stop equals that amount. The stop-loss guide shows how.
Milo, the AI market engine behind Zexca, sets the levels from the chart; the ratio is how you decide whether those levels are worth your money.
This article is education, not financial advice.
Educational content, not investment advice. Trading carries risk, including the loss of capital.